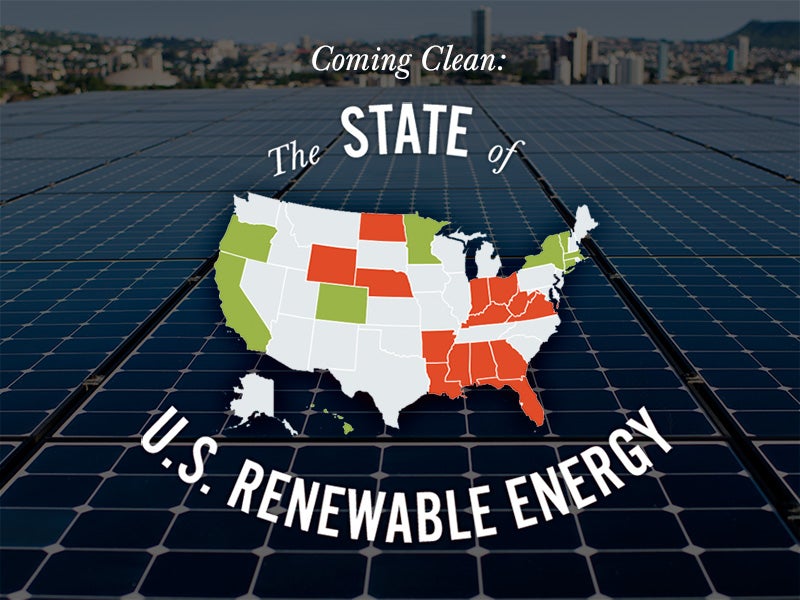
Map: Many States on Track to Meet or Exceed Clean Power Plan Renewable Energy Aims
Interactive map shows need to strengthen Plan’s state-specific clean energy targets
Contact
Today, Earthjustice released an interactive map displaying where states currently stand on renewable energy in light of the Obama Administration’s proposed Clean Power Plan. The map, Coming Clean: The State of U.S. Renewable Energy, shows that states around the country can readily comply with the Clean Power Plan and even achieve greater, faster emissions reductions by tapping their true renewable energy potential. The map also shows that finalizing the Clean Power Plan will be essential to making any progress in states that have been unwilling to invest in clean energy.
“The Clean Power Plan proposes first-ever limits on carbon pollution from the biggest contributors to climate change: dirty coal plants,” Abigail Dillen, Earthjustice Vice President of Litigation for Climate & Energy, said. “With the comment period for the plan ending the first of December, we need to support these limits, while also demanding a more ambitious final rule that reflects the role that renewable energy can and must play in tackling climate change.”
The proposed plan sets different goals for each state to reduce its carbon emissions by 2030. As one of the “building blocks” to meet these goals, the EPA estimated what each state could do to increase the share of renewable energy in its power mix.
Earthjustice’s map shows how each state stacks up on clean energy by tracking each state’s largest electricity sources, renewable energy usage, policies currently in place to reduce carbon emissions, and current renewable energy goals vs. the renewable energy targets that EPA developed in order to set proposed state-by-state limits on carbon pollution.
Some key states that stand out for embracing renewable energy, adopting innovative programs, and setting renewable energy goals that exceed EPA’s expectations in the Clean Power Plan:
- California (State: 33% by 2020; EPA: 21% by 2030)
- Colorado (State: 30% by 2020; EPA: 21% by 2030)
- Connecticut (State: 27% by 2020; EPA: 9% by 2030)
- Hawaiʻi (State: 40% by 2030; EPA: 10% by 2030)
- Massachusetts (State: 22% by 2020; EPA: 24% by 2030)
- Minnesota (State: 31% by 2020; EPA: 15% by 2030)
- New York (State: 29% by 2015; EPA: 18% by 2030)
- Oregon (State: 25% by 2025; EPA: 21% by 2030)
When looking at each state, the map takes into account a series of metrics (download the data), including:
- Whether the state already has renewable energy standards or goals in place,
- Whether those goals are voluntary or mandatory,
- Whether the state reduced carbon emissions in recent years,
- How reliant the state is on fossil fuels for its energy,
- How much solar and wind development is already underway in the state, and
- Whether it had adopted programs for climate justice.
The interactive map is part of a four-part Earthjustice web series on the Clean Power Plan that focuses on how climate change is a human rights issue, how the plan works and how it can go further to safeguard communities, where each state stands on the road to a clean energy country, and why social justice and public health leaders are hopeful for the future.
Explore the map: earthjustice.org/map

Additional Resources
About Earthjustice
Earthjustice is the premier nonprofit environmental law organization. We wield the power of law and the strength of partnership to protect people's health, to preserve magnificent places and wildlife, to advance clean energy, and to combat climate change. We are here because the earth needs a good lawyer.