Putting Industry Claims to Rest: Data Reveals Economic Success Amidst Clean Air Rules
Major cities saw simultaneous economic growth and cleaner air over the last decade.
Earlier this year, based on clear scientific evidence, the Environmental Protection Agency (EPA) proposed to strengthen a National Ambient Air Quality Standard (NAAQS) for fine particulate matter pollution, or PM2.5 for short. A strengthening of the PM2.5 national standards would force pollution sources like electricity generators and manufacturing industries to reduce their harmful emissions, resulting in saved lives, improved public health, and clearer skies. Notwithstanding the benefits, and that the majority of EPA’s independent science advisors said the proposal should even be stronger, industry is calling foul, listing costs and tales of economic woes, and essentially pitting public health against profit.
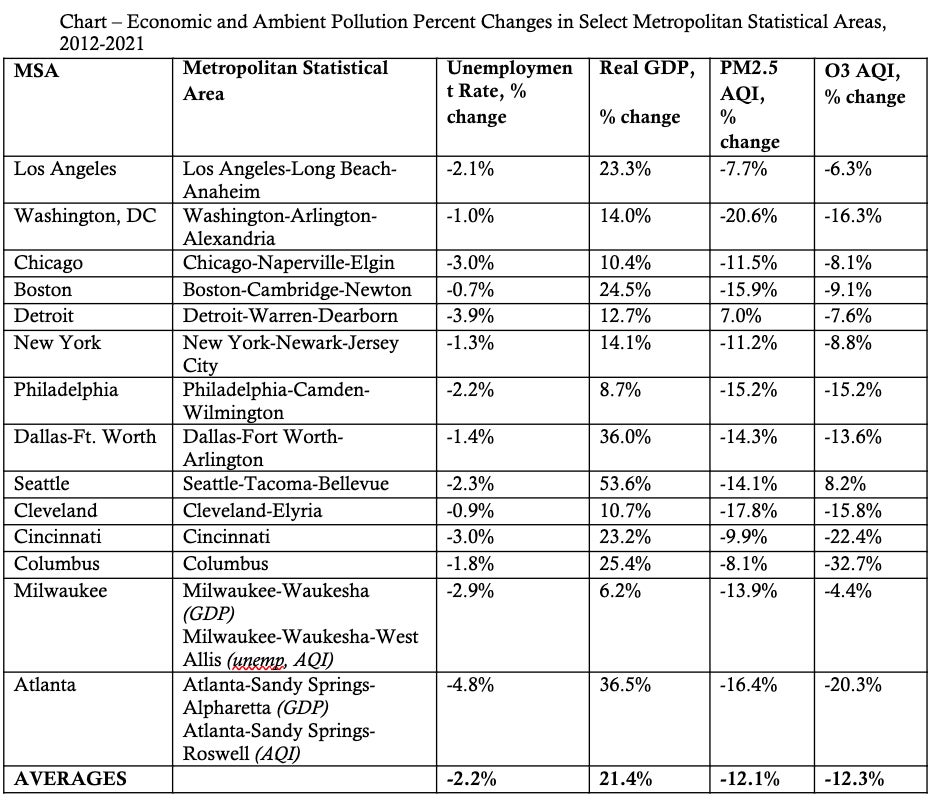
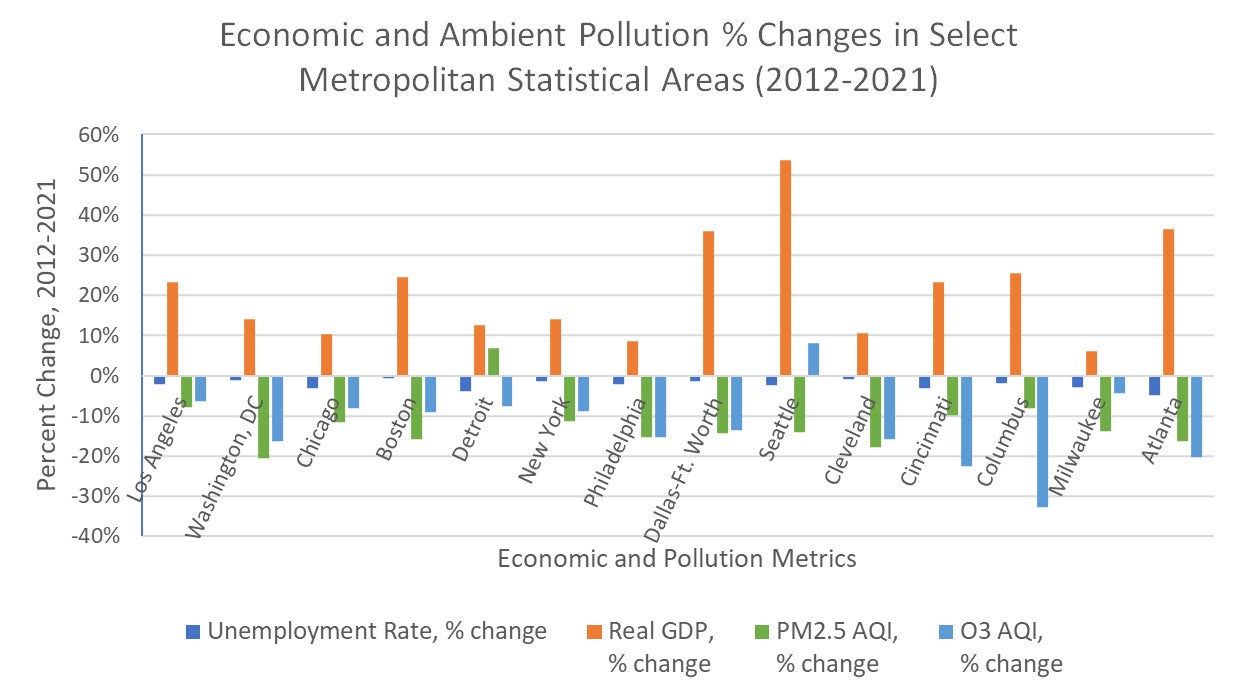
Fine particulate matter pollution kills nearly 50,000 people every year, and causes asthma attacks, hospitalizations, and emergency room visits for cardiopulmonary diseases. It is also linked to cancer. Not surprisingly, though the Clean Air Act does not allow the EPA to consider costs in setting NAAQS, industry groups seek to inject economic considerations into the rulemaking — and they do so even though economic data doesn’t back their claim. We know that’s the case because we compared real GDP (Gross Domestic Product, an inflation-adjusted measure of economic output), unemployment rates, and PM2.5 and ozone pollution air quality indices across 14 wide-ranging metropolitan areas from 2012 to 2021, and we found that economic growth can and does occur alongside reductions in harmful air pollution.
Our analysis shows that, on average across these 14 metropolitan areas, from 2012 to 2021, unemployment rates decreased 2%, real GDP increased 21%, and PM2.5 and ozone air quality indices each decreased — that is, improved — by 12%.

Comparing years 2012 to 2021 provides a snapshot of the changes in economic metrics and air quality from a period before the current PM2.5 and ozone NAAQS took effect, to conditions several years after they took effect. The data reviewed comes from the U.S. Bureau of Economic Analysis (BEA) (real GDP and unemployment rate) and the EPA (air quality index for PM2.5 and ozone). During that period, the EPA finalized NAAQS for PM2.5 and ozone. The rule finalizing the current PM2.5 NAAQS of 12 µg/m3 was published near the beginning of this 10-year period, in January 2013; prior to that time, the previous NAAQS of 15 µg/m3 remained the governing standard. Areas out of compliance with the revised NAAQS were designated a few years later, by April 2015. Following area designations, states were required to take steps to reduce fine particulate matter pollution with the goal of lowering PM2.5 concentration to the 12 µg/m3 NAAQS. The ozone NAAQS followed a roughly similar timeframe over this 10-year period, with EPA issuing a new rule tightening the NAAQS in late 2015, and implementation beginning thereafter.
Meanwhile, a recent report by an industry group, the National Association of Manufacturers (NAM), claims that strengthening the PM2.5 NAAQS will result in economic losses. This is far from the first time industry has made this claim in response to a rulemaking to improve air quality standards. As our analysis shows, their predictions have not panned out.
Indeed, several of the metropolitan areas that have experienced cleaner air and improved economic conditions are in states identified in NAM’s report as being the most “economically exposed” to improved air quality regulation; namely California, Texas, Michigan, Illinois, and Pennsylvania. While NAM forecasts California has the most to lose, data from the last time the PM2.5 NAAQS was tightened — 2012 to 2021 — show the Los Angeles metropolitan area experienced a 2.1% decrease in the unemployment rate, along with a 23% increase in real GDP, all while cutting PM2.5 pollution by nearly 8%. Similarly, NAM predicts high economic vulnerability in Texas. However, the Dallas-Fort Worth area experienced incredible growth — 36% increase in real GDP — all while improving the PM2.5 air quality index by 14%.

How could NAM in its recent report reach a conclusion so at odds with reality? Perhaps one explanation is an admitted “strong implied assumption” in its model that the manufacturing sector cannot improve its processes to be cleaner and more efficient before 2031. This assumption is hardly credible: NAM itself touts how manufacturers are constantly “transforming their own operations to achieve greater efficiency.” NAM cannot have it both ways. If anything, the assumption in NAM’s report makes it clear that industry is fishing for reasons to stop health improvements, just to be able to maximize their profits.
But our analysis offers a resounding counterpoint to industry’s persistent claims that cleaner air standards impede economic progress. The data from 2012 to 2021 tells a story of resilience and adaptation, where economic growth not only remains unhampered but often thrives amidst efforts to reduce air pollution. The lessons of the past decade demonstrate that the pursuit of cleaner air is not just good for our lungs and health, but also smart for our pockets, and that we can pave the way for a future where our well-being and our economies can breathe more easily.
Earthjustice’s Washington, D.C., office works at the federal level to prevent air and water pollution, combat climate change, and protect natural areas. We also work with communities in the Mid-Atlantic region and elsewhere to address severe local environmental health problems, including exposures to dangerous air contaminants in toxic hot spots, sewage backups and overflows, chemical disasters, and contamination of drinking water. The D.C. office has been in operation since 1978.
Tylar Greene
Public Affairs and Communications Strategist, Earthjustice
tgreene@earthjustice.org
